Next Plc (NXT) is a UK based retail group which principally sells clothing both at physical retail stores and online via the Next Directory. The company also sells home wares and furniture principally via its online sales but also in selected stores.
Growth
The stock has lost 40% of its value in the last 12 months and the reason is growth. The 4th January 2017 trading statement indicated a weakening sales picture during 2016/7 FY. The company is also guiding down 2018 Revenues by as much as 4.5%. Much of this is due to currency movements which will increase the price of imported clothing and which Next will pass on to consumers and which is predicted to cause a decrease in sales.
 |
| Next Trading Statement 2017 |
Actual guidance going forward is broad at -4.5% to 1.5% with profit before tax estimated at £680-£780m for the 2018 period. However even at £680m the company would still offer attractive value at 10.4x P/E after tax. The average 10 year P/E is 14.9x so this offers a 30% discount to the long run average - an attractive entry point given the fall in the shares to date seems to have already priced in the weakness for the next 12 months.
Next has an excellent track record of growth and evolution through difficult conditions and through its history. During the last recession in 2009 EPS fell 9% with revenues down 2% so the current sell off in the stock ahead of my forecast EPS falls of 4% this year and 10% next year offers an attractive entry point if we anticipate that the company can adapt and improve operations going into this downturn in sales.
Next has an excellent track record of growth and evolution through difficult conditions and through its history. During the last recession in 2009 EPS fell 9% with revenues down 2% so the current sell off in the stock ahead of my forecast EPS falls of 4% this year and 10% next year offers an attractive entry point if we anticipate that the company can adapt and improve operations going into this downturn in sales.
 |
| Next Annual Report |
Profitability
Next has enjoyed healthy operating margins and these peaked in 2016 at 20.0% (2015; 19.6%). Given the difficult trading conditions we should expect some contraction and I have pencilled in 18.4% for 2017 and 16.4% for 2018 and beyond. The lowest margin Next has posted in 10 years was 13.1% during the 2009 recession. A margin greater than 17% seems quite achievable in the long term especially as the company trims fat from its costs going into this cyclical downturn.
The Next business model offers a good mix for future growth and stability with 46% of profits being derived from the physical retail business and another 46% from the Next Directory online business. This gives Next a great balanced foothold in the online market alongside traditional footfall from stores.
Competitors
Next has various competitors. Within the clothing space they compete with both online retailers such as ASOS and other mixed stalwarts of the UK retail scene such as M&S, Debenhams, Topshop , Primark and the John Lewis partnership. The market it fiercely competitive.
The UK retail market is a fairly mature one and Next has a reasonable mid market positioning. Ultimately the performance of the shares and the company is being effected more by the macro environment in the UK for retailers in general and particularly importers rather than by a stock specific downturn in Next’s brands or products.
On a relative basis therefore I want to focus more on why Next may offer better value than some key competitors:
Relative Value
M&S – The company has a different mix in sales due to the heavy presence of M&S Food but I believe it is less attractive than Next due to a much higher legacy pension scheme liability, lower online sales, lower interest cover and a higher valuation at 11x past P/E. I believe M&S is attractive but at a slightly lower price than today.
Debenhams – Debenhams looks cheaper than Next on 7.7x past P/E but it is a smaller and more leveraged business with a lower consistency of past profits and it has lower operating margins. Again I think the company has an attractive valuation but it Is higher risk as Debenhams has a narrower range of sales and is stuck in a more traditional department store format without the premium brand of the John Lewis partnership. This may be a value trap.
ASOS: Not all UK retailers are suffering poor share price performance. ASOS is an online catalogue retailer with an exceptionally high valuation on past P/E. ASOS has very low net margins ~5% which have actually been falling for 5 years despite the company growing revenue 3 fold in that time period. ASOS is a classic growth stock and is expanding rapidly internationally but one is paying a ridiculous premium today to own a company that gets bigger and rapidly less profitable; an internet business is supposed to be highly scale-able.
(More on this in our next post)
Dividend
Next has shown relatively high quality returns of capital to shareholders over the past 10 years. The company has a buyback policy and also pays dividends to return that capital. The share buy backs are capped subject to a floating limit price set by an 8% Equivalent Rate of Return. This means in times of high share prices such as 2015 and 2016 buy backs were more limited and the company elected to return cash to shareholders via special dividends.
Consistency of the dividend has been strong and has risen every year in the last 10 years and it has grown by a minimum of 5% each year. The dividend is well covered by earnings and the payout ratio has been 30% as a minimum (during times of higher buy backs) and as much as 70% in 2016 via special dividends. This is an encouraging sign of a strong balance sheet, effective capital management and good quality capital allocation. Next is a mature business in a mature market and it is rightly choosing to return capital to shareholders rather than risk the folly of acquisitions or difficult entries into foreign markets.
The historical dividend yield (ex specials) has been around 2-3% but I estimate this could rise to 6-7% depending on the buyback programme.
It is likely that further special dividends should not be anticipated in the next 1-2 years on the basis of the substantially lower share price. Given the strong underlying fundamentals of the company and the lower share price I would anticipate an increase in buy backs to resume.
Going forward Next are guiding for four quarterly special dividends of 45p per share over the coming year.
Pension Arrangements
Like many UK based retailers Next has a legacy defined benefit pension scheme alongside a current defined contribution scheme. Next closed the DB scheme to new members in 2000 and in 2012 they limited future accrual of the DB scheme to 2012 earnings rather than the previous final salary basis. As of 2013 the scheme was subject to a buy-in by an insurance company to limit future risk with 21% of the fund covered in this way.
Ongoing service costs associated with the DB scheme were £8.9m in 2016 (2015; £6m) which is only around 1.5% of net profit. The total present value of the liability for the scheme is £679.4m (2015; £737.4m) which represents a reasonable 102% of 2016 net profit. The scheme is actually a net asset of £46m (2015; £37.9m) on the balance sheet due to relatively strong asset returns in recent years with total assets of £725.4m (2015; £775.3m).
However it is useful to note the underlying actual deficit to get a picture of the whole 'iceberg' so to speak and it is reassuring to see that Next generates strong profit as a multiple of its pension liabilities and that these are unlikely to grow substantially due to the closure of the scheme. Thus should the fund fall to a shortfall in the future (volatility is likely high as 51.6% of funds are invested in equities) it is likely that Next shareholders will not be unduly short changed by any additional contributions since one year's full profit could fulfill the entire existing obligation.
Leases
Next has a stronger ROE and ROA than many peers and the primary reason for this is that they tend to lease their store base. This means that operating costs are higher but capital assets are much lower. This also accounts in part for the very high P/B ratio vs industry norms.
The capital assets on the balance sheet therefore of £536.4m (2015; £503.3m) are principally fixtures and fittings in these leaseholder stores although around 15% of the assets are freehold properties. The leases themselves amount to a minimum future commitment of £1,988.7m (2015; £1,912.7m) of which around half extend for greater than six years. The longest leases extend to around 25 years.
 |
| Next Annual Report |
Adjusting for these leases as if they were capitalised on the balance sheet with £229.4m annual lease costs, an anticipated average tenure of 12 years and a rate assumed at 7% would give around £1,800m of capitalised assets. Once we adjust for depreciation expense vs leases this causes ROCE to fall from 74.8% in 2016 to 31.9% and similarly ROA falls from 28.6% to 17.7%. This is still a good return but it indicates the distortions in some metrics caused by leases which effectively reduce the asset base. Note this capitalisation would also increase net debt to EBITDA from 0.9x to 2.2x which is still a reasonable leverage level.
Qualitatively the leased stores allow Next greater flexibility. At a time where high street retail space has high levels of spare capacity due to rising levels of internet shopping the ability to exit underperforming stores in a relatively short time frame without having to sublet them due to ownership during a trend for lower demand is beneficial for Next. This makes Next more flexible than some competitors.
Qualitatively the leased stores allow Next greater flexibility. At a time where high street retail space has high levels of spare capacity due to rising levels of internet shopping the ability to exit underperforming stores in a relatively short time frame without having to sublet them due to ownership during a trend for lower demand is beneficial for Next. This makes Next more flexible than some competitors.
Debt issuance, leverage and finance
Debt remains significant in Next's capital structure with net debt at 285.8% of equity (2015; 175.7%) and 74% of total capital (2015; 64%) and has been rising due to buy backs and dividends. This leverage would appear higher were the stores also on the balance sheet. However with a strong and stable business model and excellent cash flow the group can easily meet interest payments with coverage of 27.4x (2015; 26.5x) and net debt/ EBITDA of 0.9x. (Adjusting for lease costs as if they were interest still gives coverage of ~3x).
The low equity position is due to the company paying out all its profits in the form of dividends and buybacks and hence the book value of equity remains low. The market value of equity however is £6bn which dwarfs the debt level even after adjusting for leases. The company retains very little capital but it does not need to due to excellent profitability. Should leverage levels deteriorate there is ample profitability that can be retained to maintain equity capital in the balance sheet without requiring any trim to the usual dividends only a reduction in the buyback programme.
Debt is composed of a series of corporate bonds dated 2021,2026 and 2028 and Next elects to swap the fixed coupons for floating. Total debt amounted to £875m in bonds and facilities of £525m in bank loans as at Q4 2017. These bonds are currently BBB rated and therefore investment grade.
Cash Flow Analysis
Next is a high quality cash machine. The business has generated positive free cash flow every year for the past 10 years with low capital intensity (3-5% of sales and 20-40% of profits) and this looks set to continue despite a dent in overall profitability. Interest payments are highly affordable and working capital requirements are relatively stable. This has allowed Next to pursue an aggressive buybacks strategy and distribute significant dividends to shareholders. This cash flow generation gives the company a classic margin of safety at it’s present low valuation.
Share based payments
Share based payments have a low impact on Next with many of the options currently out of the money due to the fall in the share price. There were around 5.5m options outstanding at the end of the 2016 year (2.5m were potentially dilutive) which is around 3% of the total current shares in issue. The equity settled cost was £13.7m (2015; £13.4m) with a further £7.4m (2015; £15.4m) in cash settled awards. Given the scale of buybacks and the modest issue of options it is possible that employees and management will over time gain a great percentage of control over Next. However at the present rate, and with many options out of the money the cost of these schemes should be relatively muted.
It is noteworthy that since the January 4th 2017 trading statement three of the non executive directors have each made reasonably substantial purchases of shares in Next. This insider buying is an encouraging sign that adds another element to my case for Next being attractively valued.
Credit Portfolio
Next Directory offers consumer credit on purchases.
 |
| Next Annual Report |
Income has risen from this business in
recent years due to increased credit sales driven by higher average balances
and offset by lower active accounts. This means the credit portfolio is
becoming more concentrated. However it remains relatively diversified and
offers a reasonable amount of revenue with NIM for 2016 at 15.1%. Next reduced
rates and minimum payments in 2016 to try and improve volumes.
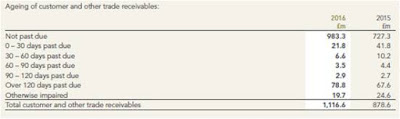
Credit quality remains relatively
stable:
 |
| Next Annual Report |
Investment Risks
Margins & Growth: The primary risk for Next is that margins and growth do not recover to levels seen over the past 5 years. This could be due to either structural shifts in the UK retail market or Next’s products becoming increasingly unpopular or unfashionable. This could lead to permanently lower margins and declining sales thus undermining the cash flow generative ability of Next and therefore its share price. Next is a mid market retailer with a reasonable brand but it lacks the pricing power of premium brands, therefore its competitive advantage lies in operations and logistics.
This risk is mitigated by the strong online presence of Next ~50% of profits and the diversified nature of their products which include fashion but also homewares. Unlike some brands such as Supergroup or Ted Baker Next has less risk from losing brand popularity and equity but as noted above it also doesn’t have their pricing power.
Debt: Financial debt levels are low but factoring in the large leasing costs of its stores Next is vulnerable to a decline in sales and profitability. The lease commitments would then become onerous and they function like financial debt due to the operational leverage they engender to the business.
This risk is limited by the ability of Next to sublet their leased properties on closure should they contract their store base. Although this risk mitigation is only useful for a structural slowdown in Next rather than a cyclical industry slowdown (which I believe we are experiencing) as during a cyclical slowdown demand for additional retail space from competitors will be muted.
Leases also offer lower risk than financial debt given that when they expire there is no notional principal to be repaid. In terms of financial debt Next is not highly leveraged except on a book value of equity basis so there remains a slight risk that declining profitability would require an increase in earnings retention to cushion against rising financing leverage thus damaging the potential dividend payout to shareholders.
Conclusion:
Next is a classic value stock hiding in plain sight. The business has a strong 10 year track record of growth and profitability, a high quality management who run the business effectively to generate returns for shareholders and presently an excellent and attractive valuation point at <9x trailing P/E. Even if Next were to grow no more in future the cash flow generation alone reinvested through the dividends would provide a healthy compound return.
Next has an excellent management and not in the sense of a series of ‘visionary’ geniuses but rather a selection of high quality managers who know how to allocate capital effectively and how to return it to shareholders when no greater opportunity for reinvestment occurs. This is a rare business which actually appears to be run for the benefit of the shareholders with no pretences to empire building.
With low debt, limited pension obligations, a strong and established physical business and high margins I would anticipate Next could rerate if the market appreciates the high quality cash flow this business offers.
I dislike forecasting the future but the past track record of Next is exemplary. Taking this forward with modest estimates I suggest an intrinsic value of around £60. This is derived from a blend of 14x 2017E earnings and 9.4x EV/EBITDA (inline with 10 year historic average P/E & EV/EBITDA) supplemented by a basic DCF and DDM valuations using a 6.8% Ke and 5% Kd.
I am usually too early on these kind of value propositions so I may well be wrong for some time on this but I expect in the long game that the present price offers a decent entry point.
Comments welcome. I want to know what I have missed!
Disclosure: I have established a modest long position in NXT. These are opinions only, not investment advice. If in doubt read my disclaimer.
No comments:
Post a Comment